The gender pay gap story is complicated and that needs to change.
While many of us would agree that like-for-like reporting of roles is one way to really delve into the extent of the gender pay gap, unfortunately that’s just not what we have at the moment.
As it stands, the national gender pay gap is commonly calculated as being the difference between women and men’s average weekly full-time earnings, expressed as a percentage.
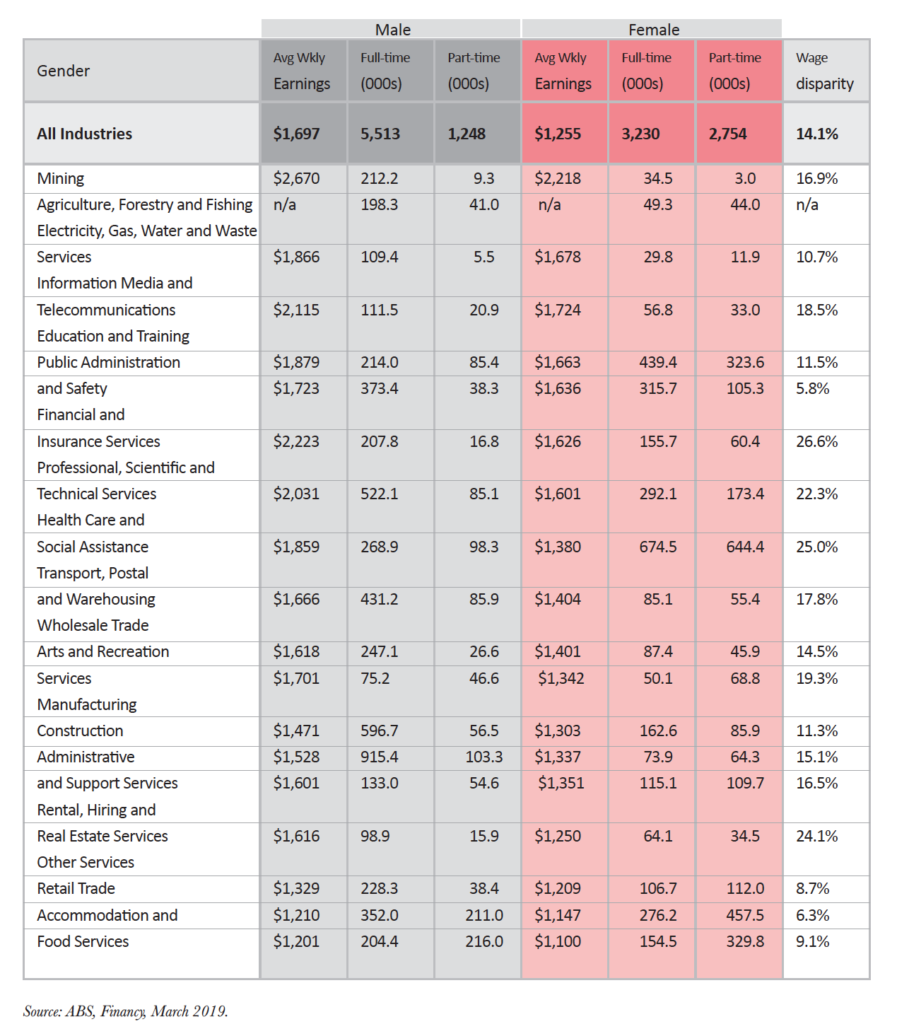
The gender pay gap as measured by the ABS Average Weekly Earnings data fell to 14.1% in November (as reported in February this year), down from 14.6% in May 2018 (as reported in August). This data is updated every six months and it’s the one we have referenced in the Financy Women’s Index for the March qtr.
The preferred but less frequent measurement of the Australian Bureau of Statistics, in calculating the gender pay gap is to use the non-managerial adult hourly ordinary time cash earnings. However this data is only available every two years.
Using this method, women earned $36.80 per hour compared to $42.20 per hour for men in 2018.
This equates to a gender pay gap of 12.8% in 2018, compared to 11% in 2016 and 13% in 2014, according to the 2018 ABS Gender Indicators report.
Irrespective of which one you look at, we have a gender pay gap.

It’s caused by many things, and it’s been called out by a number of high profile Australian TV personalities recently for it’s existence in like-for-like roles.
On the flip side of that, there are many people who argue it doesn’t exist, at least not in their progressive workplaces.
So if we take some of the debate out of the story, and just look at what affects it, here’s what we have.
The number of women in full-time employment is 3.23 million compared to 5.51 million men.
Then biggest employer of women by industry is Health Care and Social Assistance, which has about 1.3 million women compared to about 300,000 men – whom dominate higher paying management positions.
Throw into the mix the fact that Mining is the highest paying sector and is male dominated, then we have another influential factor.
Indeed it’s often said that choice is the reason women work less than men and that they select lesser paying roles or sectors.
But choice is in itself complicated. It is influenced by many factors such as history, barriers to entry, expectations, stereotypes, bias, obligation and a lack of information.


