Australia seems to lack consistency when it comes to reporting the difference between what men and women are paid – that is, the gender pay gap.
Media headlines and press releases are written for maximum impact and often the figures and methodologies used to present the gender pay gap, are not always well explained.
As it stands, the data most often used to reflect the national gender pay gap is based on Average Weekly Full-Time Earnings data from the Australian Bureau of Statistics (ABS).
From this we get a 2016 gender pay gap of 16 per cent.
This figure comes from a sample of about 5700 employers, designed to represent 8 million full-time workers, of which only 2.9 million are women.
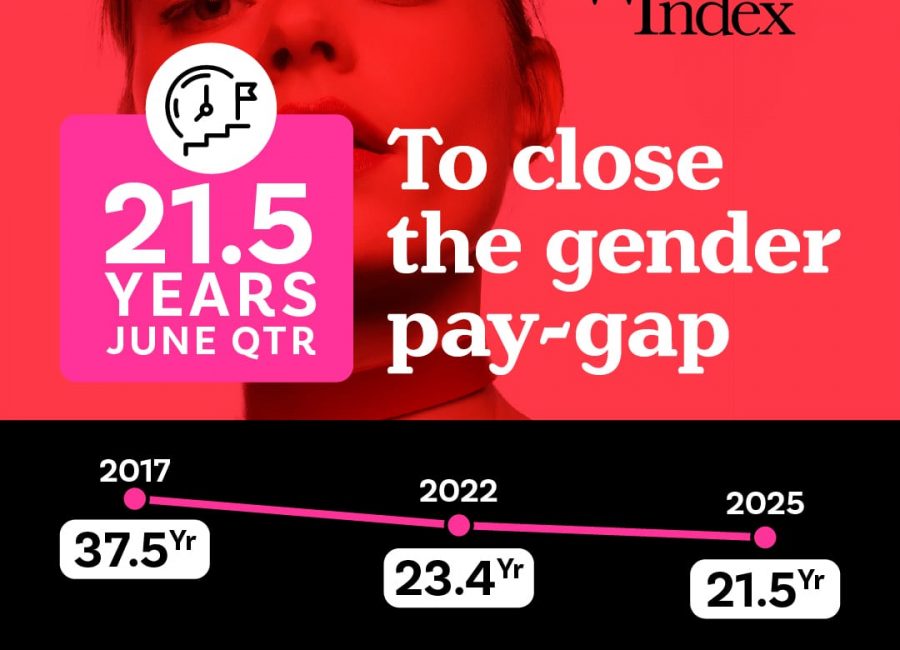
While the ABS does not produce its own gender pay gap, the data used to come up with that 16 per cent is recognized by the Workplace Gender Equality Agency (WGEA) and is also used in the Financy Women’s Index.
But it’s not the same figure reported globally by the Organisation for Economic Co-operation and Development (OECD) which has Australia’s latest gender pay gap at 15.4 per cent, based on the latest available data from 2014.
The difference comes from the fact that OECD uses the latest available median data and they take Non-Managerial Adult Ordinary Times Hours from the ABS.
Why? Because the OECD like medians – the middle point – not so much averages.
This figure however is debatable because we know that the majority of management positions in Australia are still predominately held by men across most industries.
This means the data is skewed by a concentration of women in non-management roles, and the absence of higher earning workers in management or top level roles.
WGEA on the other hand, also promotes another gender pay gap figure on the front page of its website that stands at 23.1 per cent.
What this is based on is not ABS data, but it’s own research from more than 12,000 organisations and 4 million employees.
This is less than half the number of people taken into account to come up with the national gender pay gap figure of 16 per cent.
“The Agency uses our own data, based on non-public sector organisations with 100 or more employees, to calculate gender pay gaps using base salary data and data for total remuneration,” said Andrew McMahon, executive manager of research and analytics at WGEA.
“The advantage of the Agency’s data is that it allows us to look at the gender pay gap when discretionary pay, such as bonuses and allowances, are included. When these payments are included, we see the gender pay gap in favour of men increase to 23.1 per cent,” he said.
Regardless of the data source, for about a decade, Australia’s national gender pay gap has been sitting in the range of 16 to 18 per cent in favour of men, when considering base earnings.
While the latest 16 per cent figure is the lowest it’s been over this period, the best result we’ve seen was back in 2004, when the figure fell to 14 per cent.
Data experts at the ABS put this down to the mining boom and the fact that wages took off with this, and thus the gap expanded as more men took to the industry.
Even today, there are 84 per cent men working in Australia’s highest paying sector, compared to 16 per cent women.
The average advertised wage for people working in mining is around $115,000, according to 2016 data obtained by jobs website SEEK.
By contrast, health and education, which tend to be the sectors employing the most women, pay $88,000 and $78,000 respectively on average
Aside from women working in lower paying industries, the fact that more women work part-time and take time out of the workforce to care for children, are all reasons why we have a gender pay gap.
All we need to do now is get better at presenting the data.


